The Body Measures activity is related to measure and to some themes from arithmetic (ratios and proportions) and statistics (mean, median, correlation…). Due to how the two partners structured and piloted it, the activity can also be used to suggest an approach to pupils to themes from history of sciences and can as well be used as an introduction to computing by pc and to representing measures on a graph.
Trainees are asked to make some measurements of their bodies (height, weight, length of arms, etc.). Some arithmetical or statistical computations are made using these measurements, with the aid of EXCEL software, while looking for meaningful ratios or correlations, which can also be related to Leonardo da Vinci’s hypotheses on the anatomy of human body. Similar activities will be performed with pupils and the results of their piloting will be afterwards discussed with trainees.
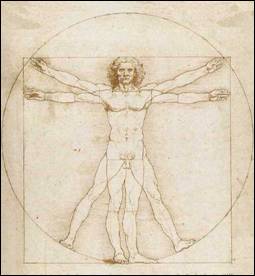
Vitruvian man by Leonardo da Vinci
Leonardo studies the proportions of the human body and its commensurability with the perfect geometric forms (the circle and the square). This was scientific analysis that had both cosmological meanings (the correspondence between micro-and macrocosm) and artistic ones (correctly representing the human figure and designing architecture based on the proportions of the human body). In this famous drawing from Venice, Leonardo subjected the “Vitruvian man” to a series of original development.
From the exhibition “La mente di Leonardo” held in Florence on September 2006
a general overview of the activity
For trainers
· Guiding trainees from theory to practice
· Letting the trainees experience an activity on their own, before proposing it to the pupils
· Providing instructions and feedback
For trainees
· Discussing about measuring and connected didactical arguments
· Knowing about the historical evolution of measuring (in particular length, weight, capacity, …)
· Experiencing measuring with respect to a given unit and working on measures
For secondary school pupils
· Experiencing measuring with respect to a given unit and working on measures
· Knowing about the historical evolution of measuring (in particular length, weight, capacity, …)
· Measuring by international standard units
· Understanding the meaning of “approximation”
· Computing the mean and median of data series
· Representing measures on a graph.
Description of the piloting of the activity
Activities in SSIS (Specialisation School for Secondary Teaching) were carried out with about 30 first year trainees, specialisation Natural Sciences, for getting the teaching qualification for Mathematics and Science in the Lower Secondary School.
Phases and timing:
· Introductory lesson on measure and presentation of Leonardo da Vinci’s excerpt (45 min)
· Measuring activity, data processing and discussion (1hr 30’)
· Piloting in the classroom (3 hours)
· Final discussion and definite outline of the proposal (45’)
SSIS students, after a theoretical introduction on the meaning of measure and its history, were presented a text by Leonardo da Vinci about “Vitruvian man”; among Leonardo’s statements we chose some that better suited an experimental verification, in particular:
“The length of a man’s outspread arms is equal to his height”
“From the elbow to the tip of the hand will be the fifth part of a man”
“From the bottom of the chin to the top of the head is one eighth of his height”.
Trainees measured one another, and then reported obtained measurements on EXCEL worksheets in order to verify whether Leonardo’s hypothesis was correct.
In the discussion that followed the activity students were invited to answer the following questions, of course focusing on the didactical aspects of the activity:
· What competencies are involved in this type of activities? What prerequisites are necessary? What learning is it aimed at?
· What difficulties did you meet in this activity? Do you believe pupils would meet further difficulties? How can we help them overcome these difficulties?
· How much and which statistics is involved in the activity? How can we capture pupils’ attention and focus them on the approximation level?
Later, two trainees, already teaching in a school, carried out piloting in the classroom: this allowed them to work with known classes and insert the activity within the curriculum. The proposal, sketched during the preliminary discussion, was adapted by trainees to their specific teaching context; the experimentation was carried out in two 6th grade classes, at about the end of the school year.
Pupils (21 in one class, 26 in the other one; aged 11-12) were asked to measure some quantities related to their bodies (height, weight, length of an arm or a foot,…), comparing the quantities thus obtained (by means of a calculator in one case and of EXCEL in the other) in a search for constants or significant correlations. In the light of Leonardo’s proposals, they were asked to answer the following questions: Is there a constant ratio between some anatomical measures? And between height and weight? If the ratio is not constant, what does that mean and what indications does it give us?
At the end experimenters reported on their activity to other trainees and commented upon some hypotheses that were formulated during the preliminary discussion.
Finally some activities for deepening the study were proposed: among the most significant, examples are the study of a link with Science teaching, through the study of children’ physical development or rather a link with History teaching, searching for still existing traces of measure units imposed on local markets.
The theme of Measure offers multiple hints for activities that present pupils with mathematical contents linked to real and concrete activities, not constrained to the restricted areas of lengths, weights or surfaces, even though in the actual teaching practice we will most probably be obliged to work with such quantities, due to practical issues. Everyday life continuously poses us measuring problems, but also portrays situations in which measure takes shapes and meanings that differ a lot: Stock Exchange indexes, dress and shoe sizes, money, statistical indexes… We are constantly offered new and more precise measuring instruments, in a search for the greatest possible exactness: a striking example is the move from manual timing to electronic timing in sports activities (athletics, skiing and so on). These initial remarks show some aspects of measuring and a possible didactical approach can be identified.
If measuring means identifying a number expressing the ratio between a given quantity and a prefixed unit of measure, for each object one can make different measurements, depending on the “quality” of the object one wants to measure: different types and with different “instruments”, ranging from the human eye to the most sophisticated devices. Although highlighting the important and essential role played by instruments we want to “demythologize” them. No perfect instruments exist and all the measures we take are always approximate. Likewise there are both measurable and non measurable quantities, at the endpoints of the measuring scale etc.
It is also well known that before coming to the current standard units of measure, humanity went through a long phase in which units of measure were fixed arbitrarily and only for commercial reasons; there was a standardisation in single markets. Using different units creates no problems if our only aim is to make a comparison or an internal ranking; but if we want to communicate the result obtained to others or simply to compare objects located in different places, we experience some problems. Hence the need to use a standard unit, equal for everyone, to identify exactly the link between different measures and communicate to others the result of a measurement. By using conventional units of measure, we get to the correct definition of measure and to its denotation by means of a number followed by a unit of measure (cm, kg, l, etc.) to identify univocally a quantitative feature of the object (dimensions, weight, capacity-volume, etc.).
Nevertheless, for some pupils this path is still to be completed; more generally many students do not have an intuitive image of the value of a measure (How wide is a window? How tall is a house? How many bottles of water would we need if we wanted to transform our classroom into a swimming pool?).
The starting point of a specific didactical path might be a reflection on the appropriate use of some specific terms, clarifying the ambiguity of certain words taken from spoken language with respect to how they are used in the different domains (for instance in common language we use the terms “big, little” as referred to either dimensions or age, “capacity” with relation to intelligence or containing, etc.). A possible interdisciplinary activity will be a revisiting with the History teacher of the historical path[1] that starting from the Commercial Revolution in the XIII-XIV centuries led to the Weights and Measures Committee constituted during the French revolution[2] and later to fix the current conventional units of measure.
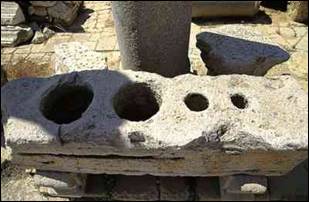
Picture 1. Ancient length and volume units from market squares
We interpreted the activity on anatomic measures that we piloted in this key: on one hand it offers ideas for a historical view and on the other hand for a reflection on the sense of measuring.
The activity was presented (two hours in the course of Mathematical Education) after students were given time to study the use of EXCEL worksheets and had dealt with measures of numeric synthesis, regression line and correlation coefficient in the Statistics course. Even though the latter topics were not central to our activity it is anyway good for teachers to know at least the basic notions, in order to gain a deeper understanding of the links between involved data.
In the introductory lesson SSIS students
were presented with some examples of “conventional” measures, locally adopted
in past centuries, before the adoption of the International System of Measures.
Then they were asked to sketch some possible activities that could help pupils
reflect upon the usefulness of standard conventional measures, going along the
path that led to the identification of some key lengths.
![]() Video 1
Video 1
During discussion trainees remarked that often in the past men made use of parts of their own body to measure lengths or of the whole body as “reference weight”. Of course this is due to the fact that it is “convenient” to carry one’s measure instrument all the time (in the same way, the arm is better than the chest circumference as an “instrument” to measure lengths…); the subjective values obtained through these instruments, though, invalidated measure and suggested the opportunity of finding ways to make measures objective. But do “anatomic constants” exist? One would reasonably say no, and it would be correct if we look at the values of involved quantities. Trainees were nevertheless faced with the fact that the situation might change if one looks at ratios between quantities[3]; we referred to the well known text by Leonardo da Vinci about the Vitruvian man.
It was noticed how most of Leonardo’s statements concern not measures per se but rather ratios between them. This hint is actually very natural: any work on the concepts of quantity and measure, either related to mathematics (length of a segment, width of an angle), or to sciences (mass, weight, pressure, absolute and relative atmospheric humidity), soon leads to talk about ratios. Measure itself is conceptually a ratio. The same happens if we report data collected during a statistical study, with determination of mean, median and calculations of percentages.
However, work on ratios often involves heterogeneous quantities and it is not always easy or possible to deal with new quantities that ratios define and the proper units of measure at the school level we are referring to. It is for this reason that the hint to work on homogeneous quantities (thus obtaining pure numbers as ratio) coming from Leonardo’s text was extremely stimulating for the initial phase of the work.
Another interesting idea comes from the possible geometrical interpretation of the constant value assumed by these ratios: they would be directly proportional quantities, and this would be easily checked on the Cartesian plane, either directly or through the application of electronic worksheets.
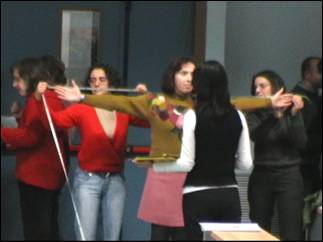
Picture 2. Trainees are measuring each other
Trainees contributed to the selection of some sentences that seemed suitable for experimental verification:
“The length of a man’s outspread arms is equal to his height”;
“From the elbow to the tip of the hand will be the fifth part of a man”[4];
“From the bottom of the chin to the top of the head is one eighth of his height”.
The remaining part of the lesson was used
as a laboratory in which trainees measured one another, and then reported
measures on some EXCEL worksheets in order to verify whether Leonardo’s
hypothesis was correct.
![]() Video 2
Video 2
“Vetruvio architetto mette nella sua opera d'architettura che lle misure dell'omo sono dalla natura disstribuite in quessto modo. Cioè, che 4 diti fa un palmo e 4 palmi fa un pie: 6 palmi fa un cubito, 4 cubiti fa un homo, e 4 chubidi fa un passo e 24 palmi fa un homo; e cqueste misure son né sua edifizi. Se ttu apri tanto le gambe che ttu cali da capo 1/14 di tua alteza, e apri e alza tanto le braccia che colle lunghe dita tu tochi la linia della sommità del capo, sappi che 'l cientro a sinistra e a destra della scala metrica delle stremità delle aperte membra fia il bellico, e Ilo spazio che si truova infra Ile gambe fia triangolo equilatero diti palimi palmi diti. Tanto apre l'omo ne' le braccia, quanto è lla sua alteza. Dal nasscimiento de'capegli alfine disotto del mento è il decimo dell'alteza de l'uomo. Dal disotto del mento alla somità del capo è l'ottavo dell'alteza de l'omo. Dal disopra del petto alla somità del capo fia il sexto dell'omo. Dal disopra del petto al nasscimiento de capegli fia la settima parte di tutto l'omo. Dalle tette al di sopra del capo fia la quarta parte dell'omo. La magíore largheza delle spaffi contiene in sé (la oct) la quarta parte dell'omo. Dal gomito alla punta della mano fra la quarta parte dell'omo. Da esso gomito al termine della ispalla fa la ottava parte d'esso omo. Tutta la mano fa la decíma parte dell'omo. Il membro virile nasscie nel mezo dell'omo. Dal disotto del pie al disotto del ginochio fia la quarta parte dell'omo. Dal disotto del ginochio al nasscimento del membro fia la quarta parte dell'omo. Le parti che ssi truovano infra il mento e 'l naso e 'l nasscimento de' capegli e quel de' cigli, ciascuno spazioper sè è ssimìle all'orecchi(i)o, è 'l terzo del volto[5]".
“Vitruvius, the architect, says in his work on architecture that the measurements of the human body are as follows that is that 4 fingers made 1 palm, and 4 palms make 1 foot, 6 palms make 1 cubit; 4 cubits make a man's height. And 4 cubits make one pace and 24 palms make a man. The length of a man’s outspread arms is equal to his height. From the roots of his hair to the bottom of his chin is the tenth of a man’s height; from the bottom of the chin to the top of the head is one eighth of his height; from the top of the breast to the roots of the hair will be the seventh part of the whole man. From the nipples to the top of the head will be the fourth part of man. The greatest width of the shoulders contains in itself the fourth part of man. From the elbow to the tip of the hand will be the fifth part of a man; and from the elbow to the angle of the armpit will be the eighth part of man. The whole hand will be the tenth part of the man. The distance from the bottom of the chin to the nose and from the roots of the hair to the eyebrows is, in each case the same, and like the ear, a third of the face[6]”.
In the subsequent discussion students were invited to answer the following questions, mainly focusing on didactical aspects of the activity:
· What competencies are involved in this type of activity? Which pre-requisites are necessary? What kind of learning is promoted?
· What difficulties have you met in this activity? Do you think pupils would meet further difficulties? How can they be helped overcome them?
· How much and which statistics are involved in the activity? How can we focus pupils’ attention on the acceptable level of approximation?
The activity itself naturally led to a
discussion about the range of precision for the measures found, due to the fact
that Leonardo’s hypothesis contains fractions, whereas matching them with the
values found in the activity essentially depend upon the accepted
approximation. This is an extremely delicate point, as confirmed by the
repletion of the experience in the classroom: trainees had taken measures with
a good approximation, whereas pupils’ measures had a greater variability and
thus required a further refinement before being used.
![]() Video 3
Video 3
Once again trainees suggested how the research field could be widened: they proposed to calculate median, standard deviation and other synthesis measures of the measures they found that way.
The stimulating question “on the basis of these measures, what meaning do the expressions tall, short, fat, thin, … assume in this sample?” showed how other measures are not only possible, but indispensable in this context, to answer questions and how it seems natural to introduce ratios between non homogeneous quantities and therefore dimensional units of measure. For instance to define fatness or thinness of a individual one cannot do without introducing the concept of body mass, expressed in g/cm. Moreover, this need might be emphasised when the declared objective is to introduce theme of ratios between non homogeneous quantities.
Before getting into the experimentation of the activity in the classroom, we discussed whether it was appropriate from a psychological viewpoint to deal with body issues with teenagers; trainees designed some didactical expedients to involve everybody without embarrassing anyone. It should be also noticed that (as it often happens) work in class strongly highlighted some of these difficulties, underestimated by trainees. It was only where the teacher himself played the game, letting students measure him, that difficulties were completely overcome, with consequent positive effects on both the success of the activity and the general climate in the classroom.
Among the SSIS students two volunteered to experiment the activity in their classes. The plan for the proposal was agreed during a collective discussion, and adapted to the different classes and to the ongoing teaching schedule. Trainees that followed the piloting (the class teacher and another trainee) were asked to pay attention to points highlighted in the discussion, also to verify hypotheses made about difficulties and about the meaningfulness of the activity.
Since the experimentation was implemented at the end of the school year, some activities were slightly reduced in favour of others which seemed more urgent or meaningful.
In what follows we report a summary of trainees’ final reports.
Grade 6, 3 hours work, 26 pupils involved
The activity was carried out in the last semester of a grade 6 class, as an instrument to recall fractions and some statistical synthesis measures. Carrying out the activity at school, where pupils measure themselves and measure one another, is highly engaging and enacts a sort of “emotional mobilisation” that favours the teacher’s job.
In taking measures some natural problems immediately arose, thus highlighting how some issues can be addressed only in a conventional and agreed way. For instance, how do you calculate the distance from the hand tip to the elbow: from the inside or from the outside? Similar difficulties were met to measure length of the feet (of course there were pupils who did not want to take off their shoes …) and also the body height of those who wanted to keep their shoes on. And pupils immediately found out that measures are … all different, also beyond those errors they could easily spot because they were linked to the use of inaccurate instruments (ruler, T square, etc.): it was not possible for the same boy to be 154, 156, 158, 159 cm tall at the same time! This fact (intrinsically more telling than a long dissertation about measurement errors and precision of instruments...) gave rise to a lively discussion, at the end of which it was agreed that three classmates would make each measurement and the “official” measure to be taken would be the median of the three measurements[7].
Pupils were particularly struck by the fact that in their class the ratio between foot length and height has a percentage frequency of 78% on the value 0.15 (notice that 1/7 is about 0.142857…). For some reason this discovery amazed them more than others; anyhow, following this route (and with similar precision…) they verified the validity of the different ratios proposed by Leonardo.
Grade 6, 3 hours work, 21 pupils involved
The class was high-achieving and the teacher thought they did not meet great difficulties with fractions and ratios. He wanted to introduce the theme of proportional quantities: in order to do so, he used some data provided by the other class colleague, inviting pupils to experiment with new ratios. In order to foster the need to introduce dimensional quantities (in this case g/cm, as agreed with SSIS trainees colleagues), the teacher proposed the study of the ratio between waist measure and body height.
This ratio presented a greater individual variability in qualitative terms, although it got to the value of 0,48 (defined as a “chubby belly”…) in 43% of cases.
The teacher then asked pupils how they could give a more precise idea of more or less “chubby belly”. Pupils answered that “it is enough to look at the weight!”; the teacher did not object and invited them to carry on.
In the school nursery room, equipped with scale and a height measuring instrument, each pupil was invited to take off their shoes and get on the scale to measure their own weight, helped by a classmate. Only few pupils (the tallest and smallest and the fattest and thinnest) were embarrassed; initially some asked the teacher to record their measures confidentially, but then they were carried by the general enthusiasm, helped by the fact that the teacher himself (obviously the tallest and chubbiest) volunteered to be measured.
A table with name, weight and height of each classmate was filled in. Initially weight was recorded in kg and height in metres; later, when they came to ratios, these measures were turned into grams and centimetres. In Table 1 there are some examples of the quantities found.
Initially the table did not include the ratio column. To introduce this concept, the teacher deliberately went back to fatness and thinness, asking pupils to agree on who were fats and thins in the class. The request raised heated arguments: Claudia and Chiara P. both weighed 49 kg, but it was clearly visible that the former was much thinner. Hence weight alone was not a good indicator of “fatness”; however it was easy to see why, in the case of the two girls: Chiara was 1,58m tall whereas Claudia was only 1,50m. But the comparison was not clear for all pairs and in any case it was a qualitative comparison, while the teacher insisted to get a quantitative comparison, through a measure of everyone’s “fatness”.
Interestingly, although pupils were working with fractions in that period and had made exercises about ratios, and although the class was rather high-achieving as we mentioned earlier, no one of the pupils thought about dividing the weight by the height, probably due to the fact that the quantities involved were not homogeneous. Finally the teacher proposed the division and, with the support of a calculator, the third numerical column of Table 1 was completed.
|
Pupil |
BODY WEIGHT |
HEIGHT |
RATIO |
|
Alessandro |
46.000 |
142 |
323 |
|
Chiara L. |
34.500 |
147 |
234 |
|
Chiara P. |
49.000 |
158 |
312 |
|
Claudia |
49.000 |
150 |
326 |
|
Ester |
26.000 |
122 |
213 |
|
Fabio |
50.000 |
144 |
347 |
|
Francesco |
42.000 |
145 |
289 |
|
Franco |
31.000 |
141 |
219 |
|
Gianna |
61.000 |
151 |
403 |
|
Giorgio |
50.000 |
153 |
326 |
|
Giovanni |
41.000 |
142 |
288 |
|
Giulia |
45.000 |
148 |
304 |
|
Loretta |
35.000 |
138 |
253 |
|
Marcello |
45.000 |
150 |
326 |
|
Marco |
41.000 |
142 |
359 |
|
Marta |
33.000 |
136 |
242 |
|
Maurizio |
59.000 |
148 |
398 |
|
Michele |
48.000 |
145 |
331 |
|
Prof. |
84.000 |
174 |
482 MAX |
|
Sunita |
51.000 |
153 |
333 |
|
Susanna |
30.000 |
142 |
196 MIN |
|
Yu Lin |
38.000 |
144 |
263 |
Table 1. Weight and Heights of pupils in a piloting class
Pupils were then asked to discuss the meaning of Chiara P.’s 312 g/cm against Claudia’s 326 g/cm. Some expressed the idea that, since dividing 39000 grams by 138 cm is like cutting the considered weight into 138 parts, each 1 cm tall, our ratios could be viewed as the expression of the weight of a “steak that could be taken from each of us” through horizontal cuts. The teacher accepted the idea, pointing out that it was necessary to think about pupils as having a perfect cylindrical shape, constituted by homogeneous material, or rather clarify that it was an “average” steak (and this allowed him to recall the concept of “arithmetic mean”).
In the end each pupil compared their “average steak” with others’; of course the greatest steak was the Mathematics teacher’s one: almost half a kilo!
At this point it was proposed to both classes to represent pairs of quantities studied up to then, as pairs of coordinates of points in a Cartesian plane. A first trial was made manually: of course the rather small range of measures required some expedients, but it was a good chance to present to pupils the use of graph paper sheets and the concept of representation to scale. Here teachers saw the results of previous discussions about approximation errors: also the most untidy pupils paid considerable attention to precision in the representation.
Representation of the relationships suggested by Leonardo did not create further difficulties and pupils could find out the existence of the predicted direct proportionality. On the contrary, more problems arose in the representation of the relationship weight-height, starting from the need to establish different scales for the two Cartesian axes. At the end of the work they got a multiplicity of points which highlighted the fact that there exists no clear proportionality between the two quantities[8].
A POSTERIORI ANALYSIS OF THE SESSION IN THE CLASSROOM
After trainees reported on their classroom experimentations, the discussion focused on the difficulties they met and on possibilities of further developments for the theme.
It was noticed how the activity naturally raised mathematical and statistical issues (approximations, graphical representations) that it is difficult to deal with in other ways.
PROPOSALS FOR FURTHER DEVELOPMENTS
At the end of the final discussion, one of the trainees (recently become a mother) proposed an activity that might represent a natural development of the experimented activity. She brought copies of two standard paediatric files, with indications of development percentiles (different for males and females) for the two quantities under consideration. On these, one might plot down obtained measures, inviting pupils to get their own development data at different ages at home, and report them on the graph.
This activity might be used in Mathematics to introduce the concepts of graph, function, percentile on a concrete example, extremely close to pupils’ interests; in Science (possibly with the support of a doctor) the activity might be used to introduce the concepts of “body development” and sense of time and individual variations in this development.
One more proposal was made to extend the experimentation, both verifying other statements made by Leonardo about pupils’ anatomy, and, through collaboration with the Art teacher, examining these ratios on classic statues (possibly drawing on Internet sources too). Following this path, it was suggested that both using Internet sources and organising simple tours around the Region, students might be led to discover traces of the first “locally conventional” units of measure, comparing for instance the “arm” locally used as unit of measure in different markets with the actual length of an arm, moving then to examine statistics about the increase in man’s average height and weight over time. A search conducted on old public or family photographs might be a way to help the pupils link observations and verify hypotheses.
SUGGESTED READING
Bussagli, M. (1999). A misura d’uomo. Leonardo e l’Uomo Vitruviano. Art e Dossier, Giunti Editore. [http://matematica.uni-bocconi.it/leonardo/uomo.htm#_ftn1]
Cambi, F. et al. (2001). L’Arcipelago dei saperi II, Area Matematica, Le Monnier, Firenze
Ferrari, D. (2005). Qualità nella misurazione: introduzione alla metrologia e guida applicativa, Milano, Franco Angeli
Piscitelli, M., Piochi, B. et al. (2001). Idee per il curricolo verticale. Progettare percorsi in Lingua, Matematica e Storia, Tecnodid, Napoli
UMI-CIIM (2001). Matematica 2001, Materiali per il XXVII Convegno Nazionale sull’Insegnamento della matematica. Lucca: Liceo Scientifico “A. Vallisneri”.
by Yves Alvez, Jean-François Chesné, Marie-Hélène Le Yaouanq
and Jacques Lubczanski, Hélène Gastin, Bernard Chareyre
Institut Universitaire de Formation des Maîtres – IUFM of Créteil, France
This activity deals with the collection and analysis of data, and it demonstrates how the trainers want to link several modules together in the training of mathematics trainee teachers.
Depending on the year, between 50 and 80 maths trainee teachers for colleges and lycees (PLC2’s) go through the IUFM training in Créteil. It includes a 42 hour-long module of mathematics classroom practices (module A). This module aims at accompanying the trainee teacher, in liaison with the educational advisor tutor, in their discovery of the teaching profession and at facilitating the build-up of their professional practice by providing them with teaching tools as well as pedagogical and didactical elements of reflection: (curriculum, working out modes of progression, preparation of sequences and sessions, evaluation, awareness of pupils’ diversity, mathematical content, specific work in algebra or in geometry…).
It also includes a probability-statistics module (module S) made up of 12 compulsory hours and six optional ones. The aim of this module is to encourage trainees to give statistics their real place within mathematics teaching in upper secondary schools.
The organisation of this module requires independent computer work from the trainees in order to familiarize themselves with the use of the spreadsheet and graphics software from statistics (integrated functions, addressing, notion of variable, algorithmic aspects, etc.) and sets out examples of classroom practices in order to explore graphical tools and descriptive statistics methods: numerical and graphical characteristics, comparisons and interpretations.
As in any training initiative, the description and reflection involved will be carried out at two levels: that of trainers towards trainees, and that of trainers interested in trainees’ practices and their effects upon pupils.
We will therefore specify our objectives and prior expectations regarding trainees, and then we will introduce the training initiative as it has been carried out this year i.e. its development from beginning to end. This will be followed with an analysis a posteriori, still on two levels, that of the session delivered by a trainee in the classroom and that more global of the initiative in its entirety. Finally, we will formulate some perspectives offered to us as IUFM trainers in Créteil and as members of the LOSSTT-IN-MATH project.
This theme (proposed by the IUFM in Créteil in the LOSSTT-IN-MATH project and strictly connected to the proposal of Body Measures) combines two key aspects of statistics teaching in upper secondary schools. The first one can be defined in terms of mathematical content to be taught (see curriculum and official directives). The second one aims at developing trainees’ critical reflection and their ability to distance themselves from the content. The integration of new technologies, to which half the module time is devoted, figures of course in this training initiative.
As for the procedures, they are worked out with work on practices in mind and not mere discourse, with the will to act upon both the cognitive and mediating components of teaching.
To be more specific, our objectives in this initiative are:
· To familiarise trainees with the use of a spreadsheet and to show them its value as a teaching tool.
· To get the trainees to act as pupils by asking them to do the work that they are then encouraged giving to their own classroom (modelling strategy).
· To introduce the notions of arithmetic mean, standard deviation and coefficient of variation of a set of data.
· To introduce an historical document (“Leonardo’s man”) and use it as an aid in the study of the mathematical notions aimed at.
· To get the trainees to deliver effectively this session with their pupils.
· To develop a pertinent use of the calculator in the classroom.
The training initiative takes place in 4 stages.
· Two sessions are devoted to mastering the use of the spreadsheet.
· During a subsequent session, the trainees are given several activities, among which is “Leonardo’s man“.
· A trainee delivers a session in the classroom.
· Return to all the trainees for feedback.
Two 3-hour sessions are devoted exclusively to introducing trainees to spreadsheet functionalities (and other software specifically related to statistics). During the course of the first session, the trainers introduce the trainees to the technical aspects or components of a spreadsheet and to its key didactical characteristics as specified in the curriculum, and then the trainees are given a number of activities (involving in particular work on addressing). The second session is devoted more specifically to use spreadsheets in statistics (statistical functions and simulation of random experiments). Two trainers for a group of about fifteen trainees run each session.
During the course of a training session, trainees are given three activities focussing on the evaluation of the dispersion of a series and on the notion of randomness. They act as pupils in each one.
The filmed session takes place in a trainee volunteer’s classroom, without any institutional evaluation. During a previous meeting, immediately before the session, the trainee has introduced her class and has presented her project to one of the trainers. In the same way, after the session, she will make some ‘on the spot’ comments.
In order to adhere to the development of the training plan, the return stage to a training module took place rather late. The trainee who delivered the session shares verbally with the others her feelings about being filmed and gives a short analysis a posteriori of the session. The other trainees intervene to ask questions. As in the “Introduction to proportionality in geometry” initiative, no training work from the video is carried out with the trainees as this mode did not figure in the initial training plan and could not be inserted here.
“HomologY”: Training by modelling
A quick reminder of the notion of modelling
The trainers transmit their own conceptions of mathematics teaching by putting them into practice in the sessions they deliver. The trainees are then expected to in turn implement in their own classrooms the sessions they have experienced as pupils. Modelling strategies differ from cultural strategies (where the trainer passes on a piece of information), from demonstration strategies (where the trainer transmits a teaching practice by implementing it effectively in his/her classroom) and from transfer strategies (where the trainer transmits referential knowledge about teaching and tries to harness the transfer phenomenon carried out by the trainees).
The training session (45 minutes) [This stage was videorecorded]
A trainer hands out the “Leonardo’s man”
drawing and its accompanying text to the trainees (see the quotation). The trainees go through both
documents quickly, and then the trainer suggests that they should focus on one
of the statements in the text “Tanto apre l’omo nelle braccia quanto è la sua alteza
– The length of a man’s outspread arms is equal to his height”. Each trainee is
then asked to pair with another and measure each other’s arm span (A) and
height (H). The trainer shows the way to proceed. Each trainee then calculates
the ratio R = A/H to the nearest 0.01 and comes to the board to write out
anonymously the values A, H and R thus obtained. The trainer points out
experimental precautions. Meanwhile, the other trainer captures on a
spreadsheet the data written down on the board. Afterwards the interest shifts
to the statistical series of R values and it is then that the question of the
dispersion of the series is brought up. Its spread having been determined, the
trainees then suggest calculating its mean and standard deviation: the trainer
takes this opportunity to point out the difference between the standard
deviation of the sample and that of the population. The trainees perform all
the calculations using a calculator, while one of the trainers carries on doing
the same on the spreadsheet. In order to refine the evaluation of the
dispersion of the series, one of the trainers suggests that the trainees should
calculate the coefficient of variation ![]() (without dimensions) and
asks them questions about the possible interpretations that can be made from
these three parameters. Has the aim of this activity, i.e the search for a
possible experimental validation of the Leonardo’s statement, been reached?
Which significance can we attribute to the value of the coefficient of
variation obtained (»4%)? Two more activities in this module (one involving the age of
the trainees, the other tables of random digits) will enable us to produce some
answers.
(without dimensions) and
asks them questions about the possible interpretations that can be made from
these three parameters. Has the aim of this activity, i.e the search for a
possible experimental validation of the Leonardo’s statement, been reached?
Which significance can we attribute to the value of the coefficient of
variation obtained (»4%)? Two more activities in this module (one involving the age of
the trainees, the other tables of random digits) will enable us to produce some
answers.
At the end of the activity, the trainers introduce the LOSSTT-IN-MATH project and ask for volunteers to deliver a session with the pupils. The trainers suggest to the trainees that they should adapt this session for their own classroom (content and procedures: for example the concept of standard deviation does not figure in the college syllabus), based on what they have experienced and felt.
The session in the classroom (50 minutes)
Presentation of the context [This stage was videorecorded]
The filmed session takes place in the framework of a ‘Path of Discovery’ in a third year class at Jean Charcot de Fresnes College, in the Val de Marne department. Charcot College, which counts 330 pupils for 25 teachers, is a “smallish” establishment.
With full teaching time allocated, these ‘Paths of Discovery’ are compulsory. They make up for 2 hours of the weekly timetable of all pupils in the middle cycle (second and third years of lower secondary college). They are added to the compulsory subjects, combining at least two disciplines structured around one common theme belonging to one of the following 4 fields:
· Natural and human sciences
· Arts and humanities
· Language and civilisations
· Design and technology
Each ‘Path of Discovery’ lasts between 12 and 13 weeks, periods for presentation, learning, work and evaluation included. So, over a school year, the pupils in the middle cycle attend two ‘Paths of Discovery’ (POD).
The POD on which the trainee is working, in collaboration with a French Teacher, covers the following topic “Journey around the World”. The second part of the study uses statistical data relating to the European Union with the following objectives in terms of mathematical content:
· To read and interpret a graph or a diagram.
· To calculate integers, frequencies, cumulated frequencies, cumulated integers and means.
· To represent a statistical series as a spreadsheet or diagram.
The session takes place after studying the chosen topic. Therefore, the pupils can a priori make use of the above-mentioned tools. Finally it must be noted that the pupils attending the session do not all come from the same class: they come from different third year classes and are regrouped for 2 hours a week (one hour with the French teacher and one hour with the maths teacher).
The teacher hands out the first worksheet to her pupils and projects Leonardo’s drawing. She asks a few questions about Leonardo, and then about the drawing itself. The pupils have to go over the square, the arms and the man (from top to toe) in colour. The teacher too goes over the lines of the projected drawing and then asks the pupils to reflect upon what they are being shown. With sustained help from their teacher, the pupils suggest that the man’s arm span is equal to his height. One pupil is sent to the board to write the concluding sentence: “A man’s height and arm span are equal”.
2nd Period (15 min)
After the reading of the instructions by a pupil, the teacher herself, together with another pupil, performs the tasks expected from all of them. The pupils then get up to pair and measure one another. The teacher allows 4 girls to remain together, she circulates between the pupils, providing help to some. As soon as the measurements are taken, the pupils go back to their seats to calculate the ratio.
The teacher hands out the second worksheet to her pupils and writes out on the board the ratios obtained. It is then strange to notice that several pupils give 1 as the A/H value. The pupils determine the minimum and the maximum of the obtained series, and then calculate its mean (which is actually 1!). The teacher then tries to get her pupils to go over what they have just done, by questioning them in particular about the significance of A/H. The period ends with the following writing on the board: “The ratios are approximately equal to 1. Arm span and height are therefore close”.
The session ends with the teacher giving homework to be completed for the following session.
A POSTERIORI ANALYSIS OF THE SESSION IN THE CLASSROOM
The pupils are placed in a U shape in the room.
Pupils’ worksheets have been well prepared, the scenario (see the quotation) has accurately foreseen the different periods planned by the teacher, and the timing of the session is defined.
The collective instructions given by the teacher are very strict, her tone of voice very firm. Individual help is however very frequently and kindly given.
The ratios having been written on the board, pupils are mostly using their calculators correctly to determine the mean of the series of ratios. There can be doubts however as to whether the choice of A/H ratio was a priori a pertinent one for third year pupils: several questions from pupils throughout the session reflect a rather vague representation of the relation A/H = 1 with A = H. The choice of precision to be given to the A/H ratio added to the absence of a unit does not seem to have been apprehended by the pupils.
The actual development of the session adheres to the teacher’s initial plan (during the meeting that followed, immediately after the session, she declared herself “pleased with the way the session went”).
The transition from observation of the drawing to conjecture is largely made with a great deal of help from the teacher, in a pretty short space of time, and it can be said that in the end this stage was not student based. The teacher starts systematically with the answers which she wishes to hear from her students “the Topaze effect” is here manifest. You may think that this is her way to manage the development of the session. But in the end, what should have appeared to the pupils as a hypothesis to be verified experimentally turned in fact into a certainty to adhere to at all costs, even if it means retaking or readjusting the measurements, to the nearest mm in the case of some pupils.
A POSTERIORI ANALYSIS OF THE TRAINING INITIATIVE
A modelling strategy aims mainly at presenting a session that the trainers consider suitable for delivery in the classroom. In any case the content and development chosen were regarded as “labelled”/ received with a seal of approval by the trainees, without the trainers’ choices being necessarily made explicit. Moreover, in giving the trainees the role of pupils, the aim is to facilitate their questioning of the prescribed tasks, which would possibly not have taken place otherwise.
Now, what transpires from the session delivered in the classroom? Training documents were properly re-used, the initial management of pupils was put back to good use but the didactical issue at stake, introduced in training, was totally missing: the trainees were to wonder about the validity of Leonardo’s statement using statistical tools available to them, the pupils tried merely to “enter Leonardo’s square”. But could the session, as constructed by the trainee volunteer, allow them to do otherwise? Indeed, it would seem that it was difficult for her to adapt the session presented in training, aimed at 6th year pupils of the upper secondary school and beyond.
She perceived the absence of standard deviation as a tool (and as a result the coefficient of variation too) as mere removal of the superfluous, when in fact it cast serious doubt over the choices made for such a session. It is reasonable therefore to think that experimental work on measurements and the calculation of ratios should be carried out before the introduction of Leonardo’s drawing and text, so that the pupils can really be made to conjuncture the existence of a law, which anyway with their current level of knowledge, they can neither validate nor invalidate. This choice together with a coherent talk would by the way enhance the teachers’ critical approach and ability to step back, aimed at during training.
The main difficulty facing trainers during maths teachers’ initial training is to know what in the practice of a novice teacher falls within professional learning generally, and more specifically what can be inferred by out of school training. It is well known nowadays how important teachers’ metacognitive representations (on mathematical content, on teaching this content, on the role of mathematics in school years, on teacher/pupils relations …) are in their practices. It is also known that not all ‘ingénieries’ (meaning: precisely constructed teaching projects), are applicable in practice and among those that are, not all are put into practice by the same teacher.
Therefore, a modelling training strategy could provide a compromise, offering both the possibility of a classroom situation, and the opportunity for trainees to question positions they may have adopted more or less consciously, regarding mathematics and their teaching.
The training initiative presented here seems to show that if such a strategy allows the modification of practices in pupil management and in the choice of activities, if it enables trainees “to do something which really works in the classroom” (according to them), it does not seem however sufficient: the trainee has failed to carry out properly the necessary work for successful adaptation. Could it have been done at this stage? Can training facilitate it? Before or after experimentation in the classroom? How can the video be exploited in initial training without putting off the trainee being filmed? And on a wider scale, what are the constraints of the observer/trainer’s initiative? We hope that the confrontation and mutually beneficial collation of presentations from the different partners in this project will enable us to bring some answers to all these questions.
SUGGESTED READING
Alvez, Y., Le Yaouanq, M.-H., Chareyre, B., Careme, Y., Cleirec, N., Gastin, H., Guillemet, D. & Saint Raymond, C. (2003-2006). Collection Math’x: seconde, collection Math’x 1S, collection Math’x TS. Editions Didier.
Henry, M. (1994). L’enseignement des probabilités: perspectives historiques, épistémologiques et didactiques. IREM de Besançon.
Quetelet, L. A. J. (1864). Histoire des sciences mathématiques et physiques chez les Belges.
Robert, C. (2003). Contes et décomptes de la statistique: Une initiation par l'exemple. Éditeur Vuibert.
Vitruvius Pollio Marcus, Architecture, ou Art de bien bastir. French translation by Martin, J. (1547). París: Jacques Gazeau.
One of the main difficulties facing trainers during mathematics initial training is to put together the general knowledge of the matter (which the trainees must have obtained in earlier studies) with the way of “teaching how to teach” such knowledge to pupils. It is well known nowadays how important teachers’ metacognitive representations (on mathematical content, on teaching this content, on the role of mathematics in school years, on teacher/pupils relations …) are in their practice. Therefore, a modelling training strategy could provide a compromise, offering both the possibility of a classroom situation, and the opportunity for trainees to revise specific contents and to question positions they may have adopted more or less consciously, regarding mathematics (or specific aspects of it) and their teaching.
Both partners piloted the experience in such a way that it became a lesson “by modelling”, i.e. proposing trainees to carry out the activity as it would be later proposed in the classroom. The discussion that followed made the trainees able to structure a proposal that took into account not only the main mathematical aspects of measuring, but also some (both practical and epistemological) obstacles identified by trainees themselves. The initial practical phase, measuring parts of their own bodies, worked as a motivating factor for trainees (as well as for students in the subsequent implementation in the classroom), but most of all it allowed them to experience most of the difficulties that were later met in the activity with pupils: for example trainees themselves felt some possible reticence when asked to communicate personal features. The whole activity enabled them to make a finer a priori analysis and, once they were in the classroom situation, they could react more promptly and appropriately to unforeseen obstacles.
The differences between the two partners’ piloting mainly lay under the following aspects:
· the phase of data collecting: IUFM exploited this activity to provide both an example of how to collect and analyse statistical data; SSIS left trainees more organisational freedom, since the aim was to structure an example of laboratory-like activity (for both partners this was also a good chance to stress that pupils can be allowed to “move and act” in the classroom)
· opening and linking this activity to other themes:
o for IUFM: the use of software, reading of an historical document and education to citizenship;
o for SSIS: the general approach to the history of measure and the introduction of ratios between non-homogeneous quantities.
The choice made by SSIS not to structure rigidly the analysis of collected data allowed for a less complicated and more involving work with trainees in the initial phase, but turned out to be less efficacious in the phase of comparison of classroom experiences. However this could not be avoided, due to the situation of the SSIS courses, characterised by the fact that many students (but not all of them) are already teaching in a class and the activity must be included in the actual curriculum. On the contrary it is the first teaching year for all the trainees in Créteil, who are part-time teachers under the supervision of a tutor: despite of such a guided training session, it was not easy for them to adapt the activity to their own classes.
Besides the two partners, the proposal was also partly piloted in Skårup Seminar (by Seminarielektor Helge Thygesen). In that piloting, the trainees worked only the first phase of the proposal: measuring themselves and discussing about discoveries. Firstly they aimed to verify the correctness of the hypothesis that “The opening of arms [and shoulders] of a man equals his height”; this was easily shown to be true by some measures and a simple EXCEL worksheet. But the trainees had previously worked with the golden section, so the teacher invited them to verify also that in general the ratio between one’s height and the distance from one’s navel and the ground equals the golden number. Indeed the evaluation following this activity led to the conclusion that it was not likely that there was such a standard ratio: the individual results differed too much from the expected results. But again interesting considerations came out on art and mathematics.
Lectures in Skårup ended by talking about measuring children in the school. The conclusion was that it was a very good idea to let children measure themselves. Trainees supposed that such an activity would definitely be of interest for the children and might generate an interest in Old Danish measures like “favn” and “fod” that obviously derived from body measures.
However a point deserves to be stressed: the teacher must be careful when dealing with body issues with teenagers; in both full piloting activities, trainees were led to design some didactical expedients trying to not embarrass anyone, and piloting in the classroom revealed how hard psychological difficulties can raise. Difficulties were completely overcome only where the teacher deeply involved himself in the game; this was in fact the key passage: the teacher became an educational model, when faced to the acceptation of one’s “difference” from standard ideas of body fitness.
The proposed activity substantially reached its aims, both for trainees and for secondary school pupils; the same happened in the piloting in Skårup. Surely such an activity (more in general any activity inspired to modelling strategy) enables trainees “to do something which really works in the classroom”, according to the trainees in IUFM of Créteil. However it did not seem sufficient: the same trainees have often failed to carry out properly the necessary work for successful adaptation. Hence some natural questions arise, which concern mainly trainers, on how can teaching by modelling be enriched to overcome such a gap.
© LOSSTT-IN-MATH Project